

LAKE FOREST, Ill.—With runs on two U.S. banks within the past month, and the nation’s attention focused on consumers’ concerns over the safety of their funds, just how much money still resides in liquid, low-yielding DDAs and could be ripe for movement?
According to a new study, a whopping $2.2 trillion can be found sitting in such accounts, in most cases, checking.

As the country works to avert a potential banking crisis, Michael Moebs, economist and CEO at Moebs $ervices—which just completed a study of U.S. money supply growth—reminded there a lot of liquid dollars at risk, and pointed out exactly where they are. Moebs also outlined strategies for credit union leaders to consider in retaining deposits.
“Deposits are gold now,” said Moebs, who pointed out that financial institutions are not only facing growing consumer concerns over safety and soundness but a liquidity crunch at the same time.
“It is extremely important to keep the deposits you have and get new deposits, too, if you can. Increasing rates is key to keeping and getting deposits,” added Moebs.
M1 + M2 + M3 = Record Increase
The Moebs $ervices Money Supply Study shows the U.S money supply increased $7.5 trillion from 2018-2022, measuring M1–transaction accounts or checking, M2–insured savings and M3–uninsured savings.
“This is the largest monetary growth in U.S. history,” said Moebs. “Measurements of M1 and M2 blended when the Federal Reserve eliminated reserves and transfer limits on St. Patrick’s Day in 2020. Yet, it is important these monetary aggregates be kept separate. M1 represents those living paycheck to paycheck. M2 consists of savers who want deposit insurance and are riskless. M3 are investors and traders’ holdings of cash between sales and purchases of securities.
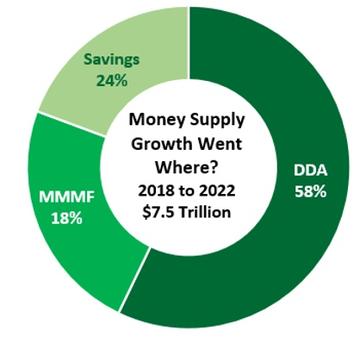
“Since 1914, or 109 years ago, when the Fed started to measure the combined monetary growth of demand deposit transaction accounts, deposit savings and investment cash, these funds have grown at 7% measured by 432 year-to-year quarterly changes,” continued Moebs, before asking, “Where has this $7.5 trillion in funds gone?”
Where the Money Moved
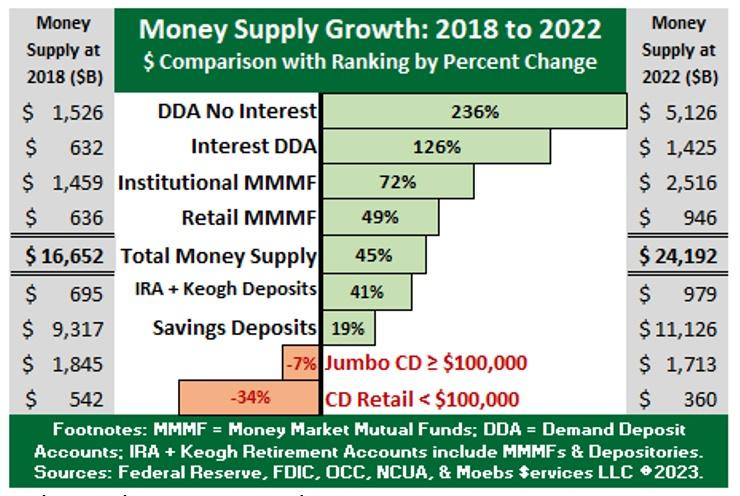
In response, Moebs pointed to data from his company’s study (see chart above) that outlines the money movement.
“The period encompasses the COVID pandemic of 2020 to 2022 and uses 2018-19 as a benchmark,” explained Moebs. “From 2018 to 2022, money grew 45%. Growth rates were volatile: 22% to -0.38%. Individual services show a wide range of 236% for DDA to -34% for retail CDs. This is uncommon and not normal growth.”
What is normal money supply growth?
The average monetary growth rate of 7% times the 2018 base of $16.652 trillion produces a normal, target money supply of $21.827 trillion at 2022 yearend, explained Moebs.
The Difference
“The difference of the actual growth rate and the normal rate results in $2.365 trillion in excess money supply,” Moebs continued. “This excess growth causes inflation—too much money chasing too few goods and services, creating a paradox of how to control and potentially reduce prices and potentially supply.”
Moebs reminded that to avert a severe recession during the pandemic, the Fed and Congress issued stimulus funds.
“However, much of the stimulus funds were not used and were nestled away by the consumer. Congress again issued stimulus funds in 2021 and most of this was stored,” Moebs noted.
The Big Winner
Moebs outlined why checking was the “big winner” from the record growth in money supply:
- Savers hoarded this money in their checking accounts. Non-interest DDA rose $3.6 trillion, or 236%, “which is unprecedented,” said Moebs. Interest DDA increased $793 billion, or 126%. “There was $4.4 trillion more in 2022 for all DDA than in 2018.”
- Investment managers at the institutional money market mutual funds (MMMF) hoarded extra cash, or $1.1 trillion more. “Retail MMMF managers expanded at a more normative rate with $310 billion more in cash,” he said.
- Retirement accounts grew $284 billion, or 41%—similar to money supply growth, Moebs said.
- “Savings deposits and money market deposit accounts are combined to increase one-half of money supply growth. Yet, these deposits represent $11.1 trillion, or 46%, of all money supply at all financial institutions,” Moebs said.
- “CDs decreased as consumers prefer DDA to access and move funds quickly. Jumbo CDs lost $132 billion and retail CDs lost $182 billion,” explained Moebs. “This signals rates will become important for profitable CDs with balances sufficient to earn a profit.”
Strategies Suggested

Michael Moebs
Moebs again noted that $7.5 trillion (see chart) went primarily into DDA checking—both interest and non-interest bearing—and more than savings and money market deposit account growth combined.
To retain these liquid funds, Mobes outlined steps:
- Calculate a profit level for deposit balances, and then pay rates high enough to keep these funds
- Decide if the CU wants to be in the retail CD business and, if so, pay higher interest rates
- Higher rates on deposits require more fee revenue from overdrafts, minimum balances, etc.
- MMMFs can be defeated by emphasizing strong capital and deposit insurance
- Moebs asserted that common sense will eventually prevail over financial institution depositors.
No Need to Panic
“Will depositors lose their money? Those who had more than $250,000 in deposits, which is the deposit insurance limit, might lose some funds. Those below $250,000 will not lose a penny,” offered Moebs. “Will a panic set in and other banks, credit unions, and thrifts fail? No, because in the U.S. financial institutions have enough capital and good management along with deposit insurance. It is the bad apples like Silicon Valley Bank and Signature Bank which stain the barrel and are caught and thrown away.”